

Exploring the latest report from the National Study of Learning, Voting, and Engagement
What does 2022 mean for 2024?

For the past decade, Tufts University’s National Study of Learning, Voting, and Engagement (NSLVE) has been a pivotal resource for studying college student voter registration and turnout as a proxy for political learning. Following every federal election cycle, NSLVE’s biennial reports provide the most robust and detailed snapshot of student voting behavior that is publicly available. On Thursday, NSLVE released its latest national report, Democracy Counts 2022, which details the study’s findings from nearly 11 million de-identified college students nationwide during the last election cycle.
A rising baseline amidst a difficult voting environment
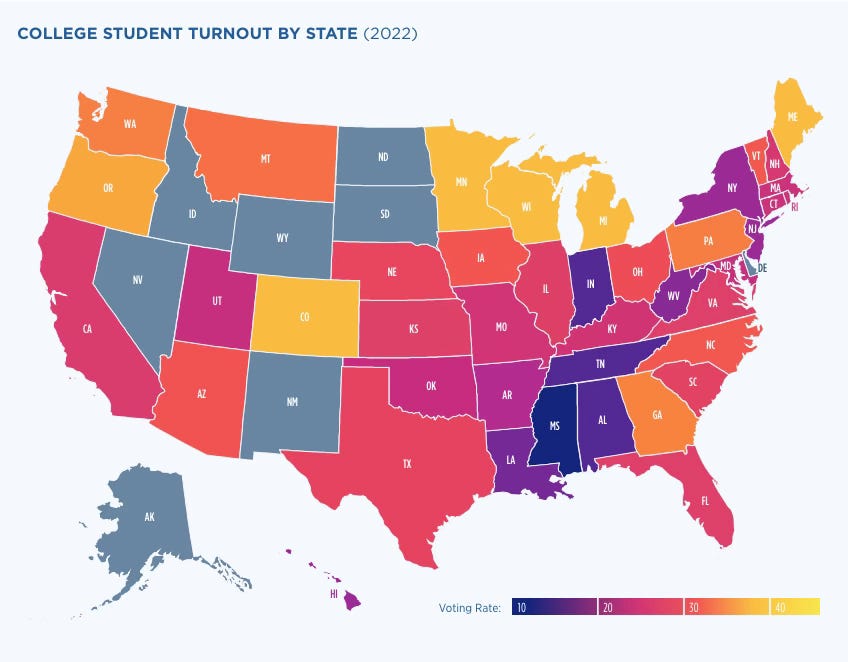
The NSLVE team found that 31.3% of all US college students voted in the 2022 midterms, down from roughly 40% in 2018 but still considerably higher than the approximately 19% who voted in 2014 (the first year that NSLVE began collecting midterm data). That being said, a simple topline comparison between election cycles always tells an incomplete story - and this year is no exception.
A closer look at the 2022 data reveals ample evidence that the burgeoning efforts to incorporate the democratic purpose of higher education into the college experience continue to make a significant impact on students nationwide. History may well look back at the 2018 and 2020 election cycles (which both saw historic growth in student voter turnout) as unique years for voting with distinctly high participation rates across the entire electorate. That colleges and universities were able to sustain much of the gains made across those cycles among a mostly new cohort of students, in a year when voting rates were down overall, points to a potentially rising baseline of student voter participation compared to historical norms; long-term progress may be visible in the longview, as longitudinal data accrues..
Registration rates remained high in 2022
Voter registration among college students remained robust in 2022, with a rate of 76.1% of eligible students registered to vote - slightly surpassing the 74.8% registration rate in 2018. This consistency suggests that efforts to help students register to vote, including outreach on college campuses, have been largely successful and are becoming ingrained in campus culture. However, the yield rate - the percentage of registered students who actually voted after registering - dropped significantly, from 52.6% in 2018 to 41.3% in 2022. This means that while most students were registered, less than half of those registered actually cast a ballot.
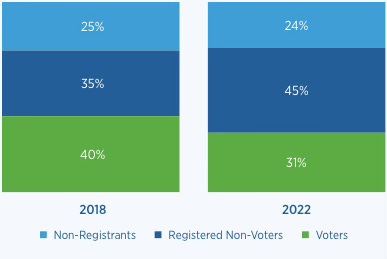
The disconnect between high registration and low turnout rates points to challenges for student voters. This could indicate barriers to voting that persist even after registration, such as lack of transportation to polling places, difficulties with absentee voting, competing priorities on Election Day, or motivational barriers. It may also suggest a need for sustained engagement and education efforts beyond get out the vote (GOTV) initiatives, to help students understand the voting process, the historical arc of democracy in the United States, and the importance of student voice. Going forward, higher education institutions and civic organizations looking to engage students need to focus more resources on building a culture of civic engagement and democratic learning, rather than solely on registration. Additionally, exploring further research behind low yield rates could provide valuable insights for improvement towards the goal of 100% student participation in future elections. A lot of work needs to be done between now and Election Day, but educators should take solace in seeing sustained progress over time.
Equity gaps need to be a point of focus in every election cycle
One area for concern in the 2022 data is that several trends toward increased voter equity appeared to regress when compared with past cycles. In 2018, Black college students turned out at just two percentage points lower than their white counterparts, while Hispanic students saw a gap of seven percentage points. In 2022 those numbers grew to 10 and 12 percentage points, respectively.
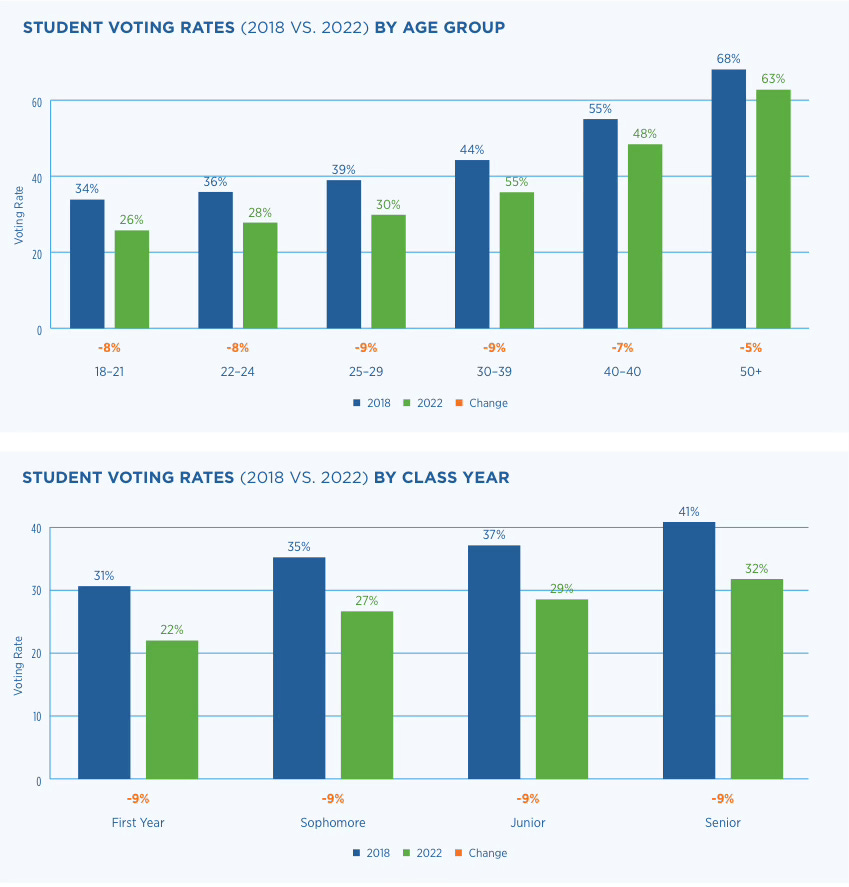
The turnout gap between age groups also reveals some areas for concern. Following a 2020 election in which voters ages 18-21 turned out at higher rates than voters 22 and older, 2022 saw a reversion to historical norms in which the youngest age group of voters turned out at lower rates than their older counterparts. It is worth noting, however, that when compared to 2018, turnout gaps between voters 18-21 and all other student voters in their 20’s has decreased.
Overall, the political equity gaps and the re-emergence of an age gap represent a pause on what had been years-long trends toward voter parity, and highlight that even in the face of recent success, closing equity gaps needs to be a point of focus among student civic leaders going forward.
Local conditions matter
Democracy Counts 2022 also revealed significant geographic and demographic variations. Student voter turnout in Michigan, for example, stood out compared to the rest of the country, growing by seven percentage points compared to the state’s rate in 2018. It’s impossible to know the exact reasons why Michigan stood out from the pack, but the likeliest explanations include the state’s generally competitive elections, a high-profile abortion rights referendum on the ballot on election day, and voter-friendly policies such as same-day registration, which was passed in Michigan in 2018.
There is obviously no way to perfectly recreate these conditions in the other states, but studying Michigan’s success and working to make voting both more appealing and easier - whether through awareness campaigns highlighting lesser-known local elections or referenda that may be more competitive than statewide or national elections, or through voter education campaigns that help make the voting process more palatable in states with more restrictive laws - could result in a working blueprint for states with historically lower student voter turnout rates.
The upshot: 2024 offers a massive opportunity to grow the student vote over the long term
While 2022 saw a decline from recent high-water marks, college student voting rates remain well above historical baselines for midterm elections. The NSLVE data highlights both progress made and ongoing challenges in fostering student political engagement. Given the timing of its release, it’s impossible to fully separate the content of NSLVE’s 2022 data from its implications for the 2024 elections. One area that stands out as particularly intriguing is the sustained high student voter registration rates across the last three federal election cycles, which likely indicate a lasting carryover effect of registration efforts across multiple elections. In other words, one major reason that so many student voters were registered in 2022 is probably that they were registered in 2020, an election that drew much more national attention by comparison.
More broadly, the high profile nature of presidential elections offers a rare opportunity to foster student political learning at a time when the vast majority of students are paying attention to the electoral process. That not only means institutions should set their aims high for student voter participation in 2024, but also that they should seize this opportunity to examine institutional practices and continue to build infrastructure in a way that yields lasting impact on student civic participation and learning during future election seasons - much in the way 2020 likely did for 2022.
 | A guest post by
|
Excellent overview! Thanks for posting. This is helpful context for the work ahead.